I have not produced much that is visible, but I have been thinking about my action plan and how to proceed in preparation for next Saturday. I have had some trouble wrapping my mind around how what I wanted to do fits into the whole culture of Cohort 21. I was worried that I would end up simply presenting a whole whack of information, and not really present anything suggesting transformation in my own practice or to help others.
As part of my goal to reposition myself and the library at RSGC I have thought a lot about the conversations at Cohort 21. I think my project, positioning visualization as a learning technique, meshes well with the goals of 21st century learning. Visualization is possible because it is a technology infused activity, from simple Wordles to Excel to more comprehensive and technical software packages. The massive wave of open data that is available because of the Internet means there is a rich source of content for visualization. This same glut of information makes it critical that students (and teachers) develop the skill to manipulate and interpret large data sets.
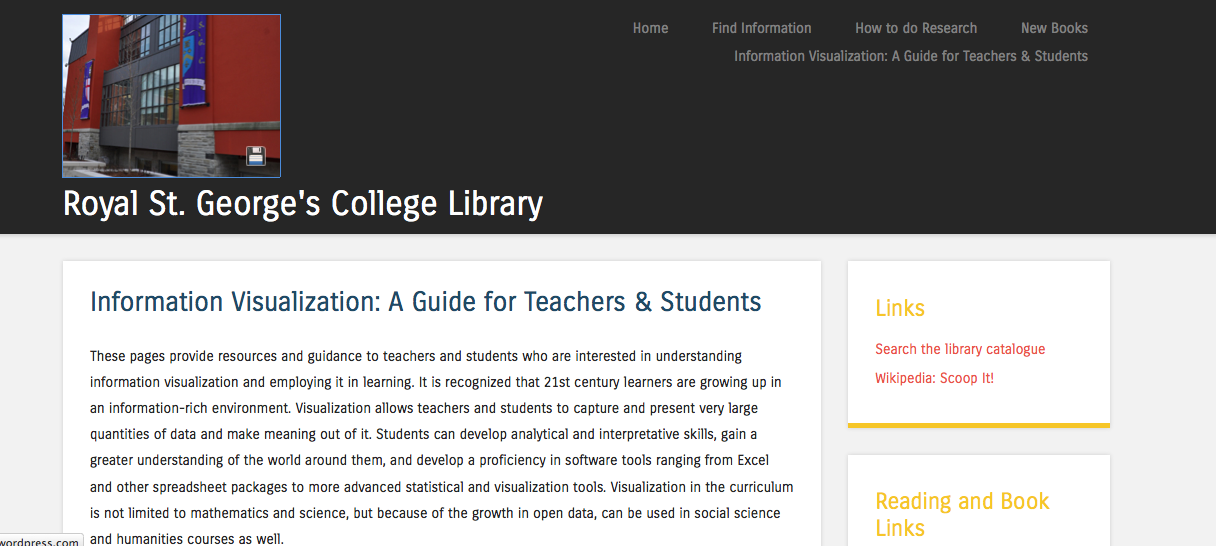
By Saturday I will not be as far along as I want. I have been working on integrating information on visualization into the RSGC website.
The pages will provide examples, but more importantly access to resources and instruction on how to use visualization in the classroom.
Look for more in future posts this week!

Hi Tim,
Try visual.ly
This could help students be more “data literate”
http://youtu.be/sCmO8YKzv9U
Thanks for this post Tim, and though short on the distance, you have created a great start to a very important and resource for teachers and students. Well done! I look forward to hearing and “seeing” more about this visualization resource.
Thanks, and see you on Saturday!